FILTRIX Tutorial
How to Read Context Analysis Results
Learn how to interpret FILTRIX Context Analysis results, including total historical matches, included calculation rows, close-position bands, range buckets, preview rows, and saved contexts.
What You Will Learn
- Understand Total found in history versus Included in calculation (n).
- Read the close-position band before judging the result.
- Interpret Above range, Below range, In range, and their Up/Down/Equal splits.
- Know when to save, export, discard, or move into Execution Analysis.
Before You Start
- A completed Context Analysis result.
- The filters and outcome used to create the result.
- A specific question, such as whether similar alerts usually held a strong close.
Start with how many examples were found
Total found in history is the number of historical alerts that matched your filters. Included in calculation (n) is how many of those rows FILTRIX could actually use for the selected outcome after removing rows without the needed close data.
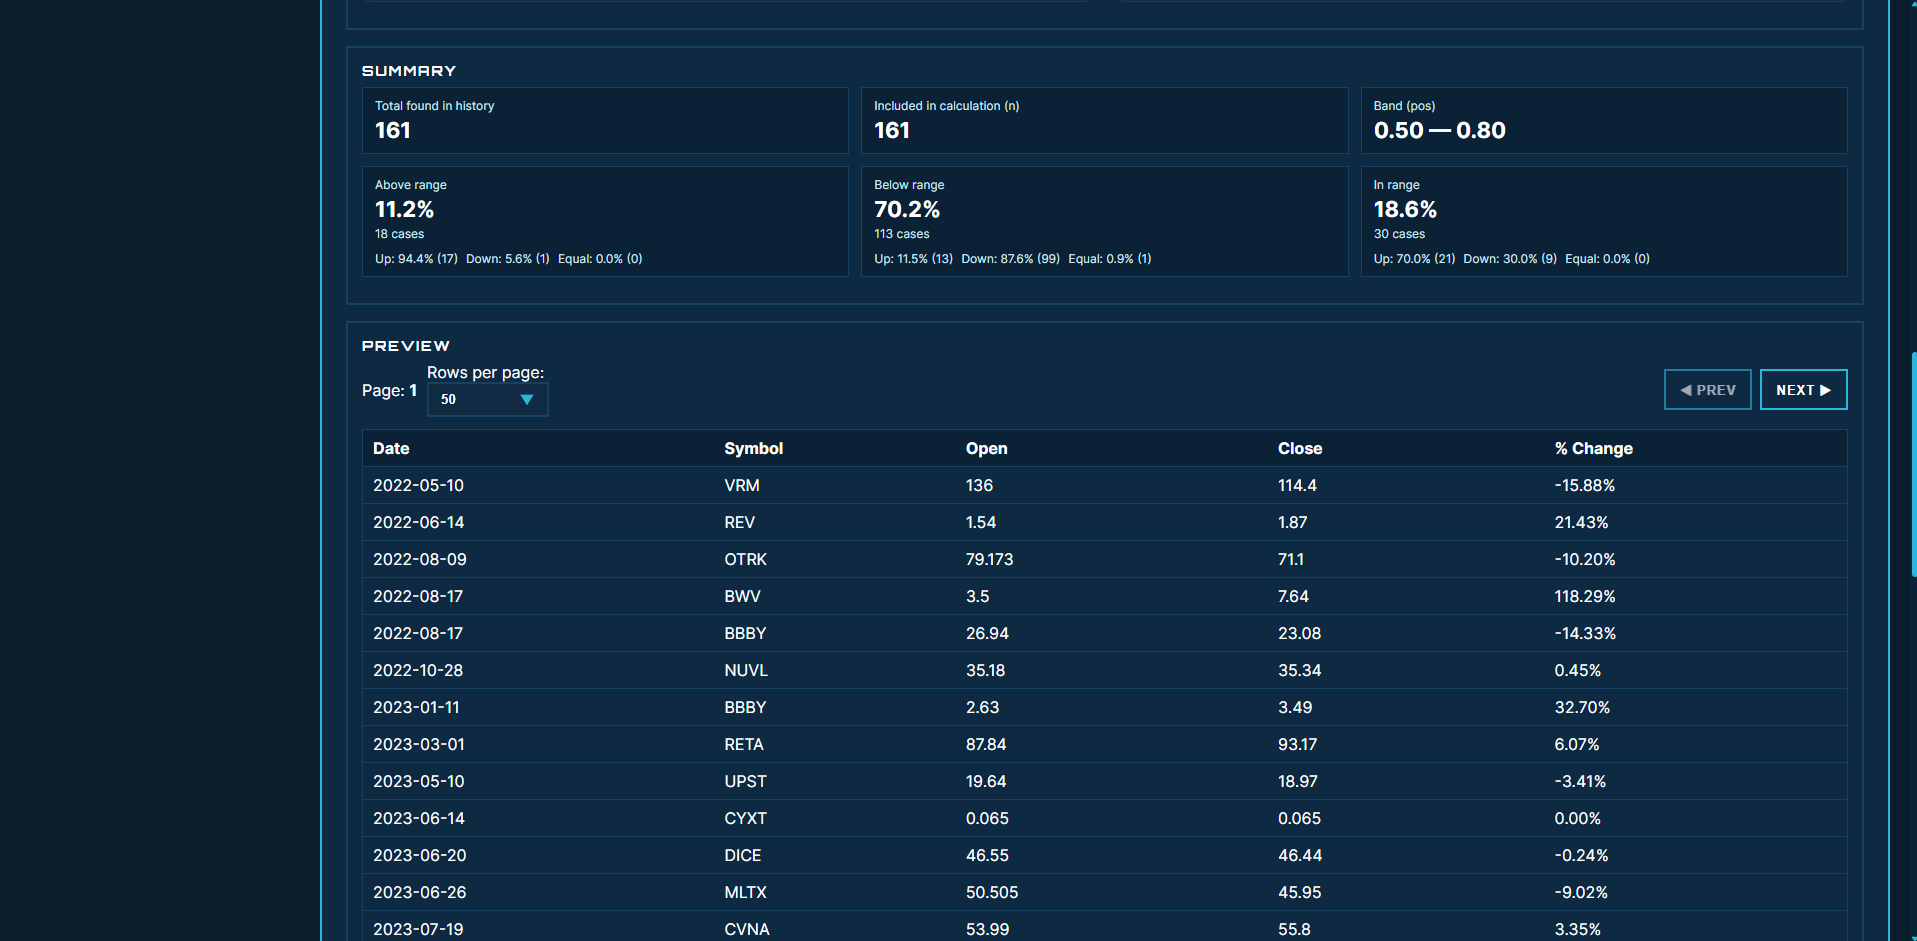
/static/images/tutorials/read-context-analysis-results/01-sample-size.png
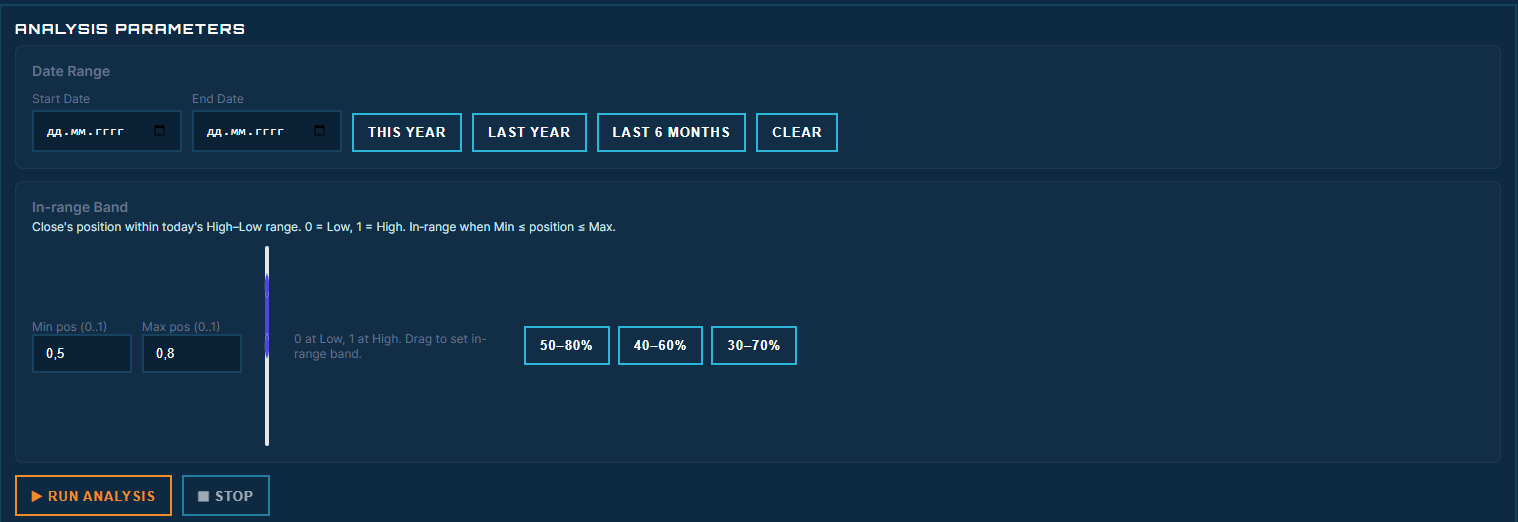
Understand the close-position band
For the daily close position outcome, FILTRIX maps the close inside the day's range: 0.00 means near the low, 1.00 means near the high. A Band (pos) of 0.50 to 0.80 means you are treating closes in the middle-to-upper part of the range as the neutral zone.
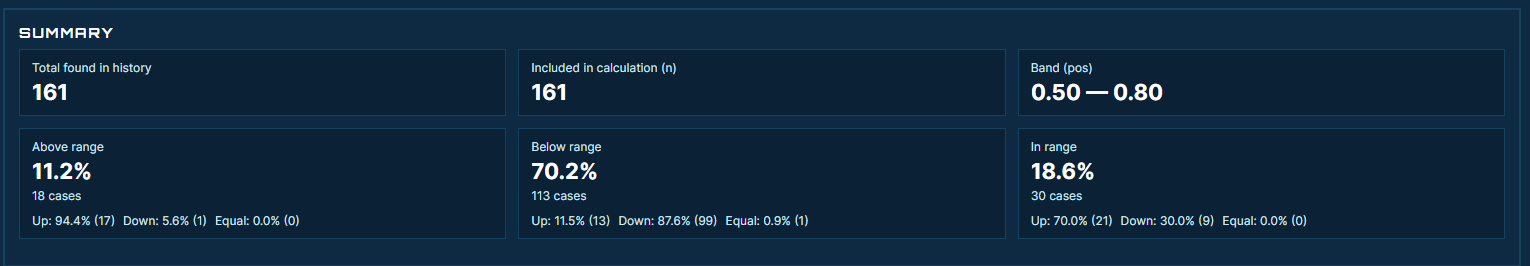
/static/images/tutorials/read-context-analysis-results/02-band.png
Read the buckets and their internal split
Above range means the close finished above the top of your band. Below range means it finished below the bottom of the band. In range means it stayed inside the band. The largest bucket tells you where similar setups most often ended the day. Inside each bucket, Up, Down, and Equal compare the regular close with the regular open — use that split to see whether the bucket mostly contained green closes, red closes, or flat closes.
/static/images/tutorials/read-context-analysis-results/03-buckets.png
Sanity-check preview rows and decide
Preview rows show the actual historical records behind the summary. They help you catch bad filters, strange outliers, or a result that looks strong only because a few unusual days dominate the sample. With clean rows and enough examples, save the context with a descriptive name and move to Execution Analysis. If the result is weak, noisy, or too small, discard it or adjust the filters before spending time on simulation.
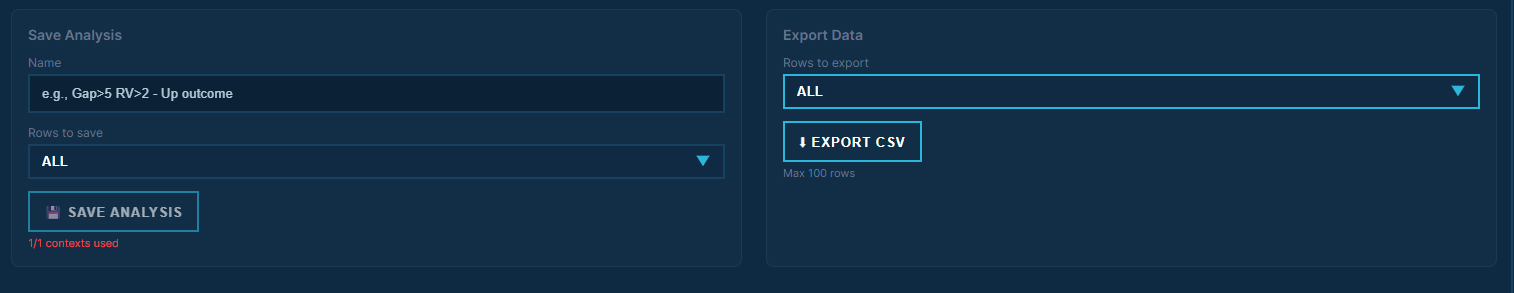
/static/images/tutorials/read-context-analysis-results/04-decide.png
Common Mistakes to Avoid
- Do not call every percentage a win rate. First confirm what outcome and band the result uses.
- Do not treat Above range as automatically good. It is good only if it matches your thesis.
- Do not ignore a gap between Total found and Included in calculation (n).
- Do not save every experiment. Save only contexts you can explain and reuse.
Next Tutorials
How to Run Execution Analysis
Use a saved FILTRIX context to preview intraday execution rules: choose pairs, timeframe, side, entry and exit logic, then review the strategy summary and trade charts.
How to Validate a Trade-Ideas Alert
Turn any Trade-Ideas alert into measurable filters and check it against 400K+ historical alerts before you trade. Read the alert as data, translate it to FILTRIX filters, and decide whether the setup deserves real risk.
How to Use FILTRIX
Learn the complete FILTRIX workflow: create an account, build a trading context, run your first analysis, save it, and test execution.
Ready to test the setup?
Open FILTRIX, build the context, and let the data decide before you chase the next alert.
Open Context Analysis