FILTRIX Tutorial
How to Run Execution Analysis
Use a saved FILTRIX context to preview intraday execution rules: choose pairs, timeframe, side, entry and exit logic, then review the strategy summary and trade charts.
What You Will Learn
- Choose the saved context you want to test.
- Set pairs to simulate, timeframe, and long or short side.
- Configure entry and exit rules that match your real plan.
- Read Trades, Win rate, Profit Factor, Total PnL, and per-trade charts.
Before You Start
- At least one saved Context Analysis run.
- A clear long or short thesis.
- A practical entry and exit idea you would actually trade.
Set up the run: context, pairs, timeframe, and side
The saved context defines the historical date and symbol pairs that can be simulated. Start with a modest pair count like 25 or 50 so you can inspect the result quickly before running a larger preview. Timeframe controls how one-minute bars are grouped before the rule is tested. Side controls whether PnL is calculated as a long trade or a short trade — the same context can look very different when you change either one.
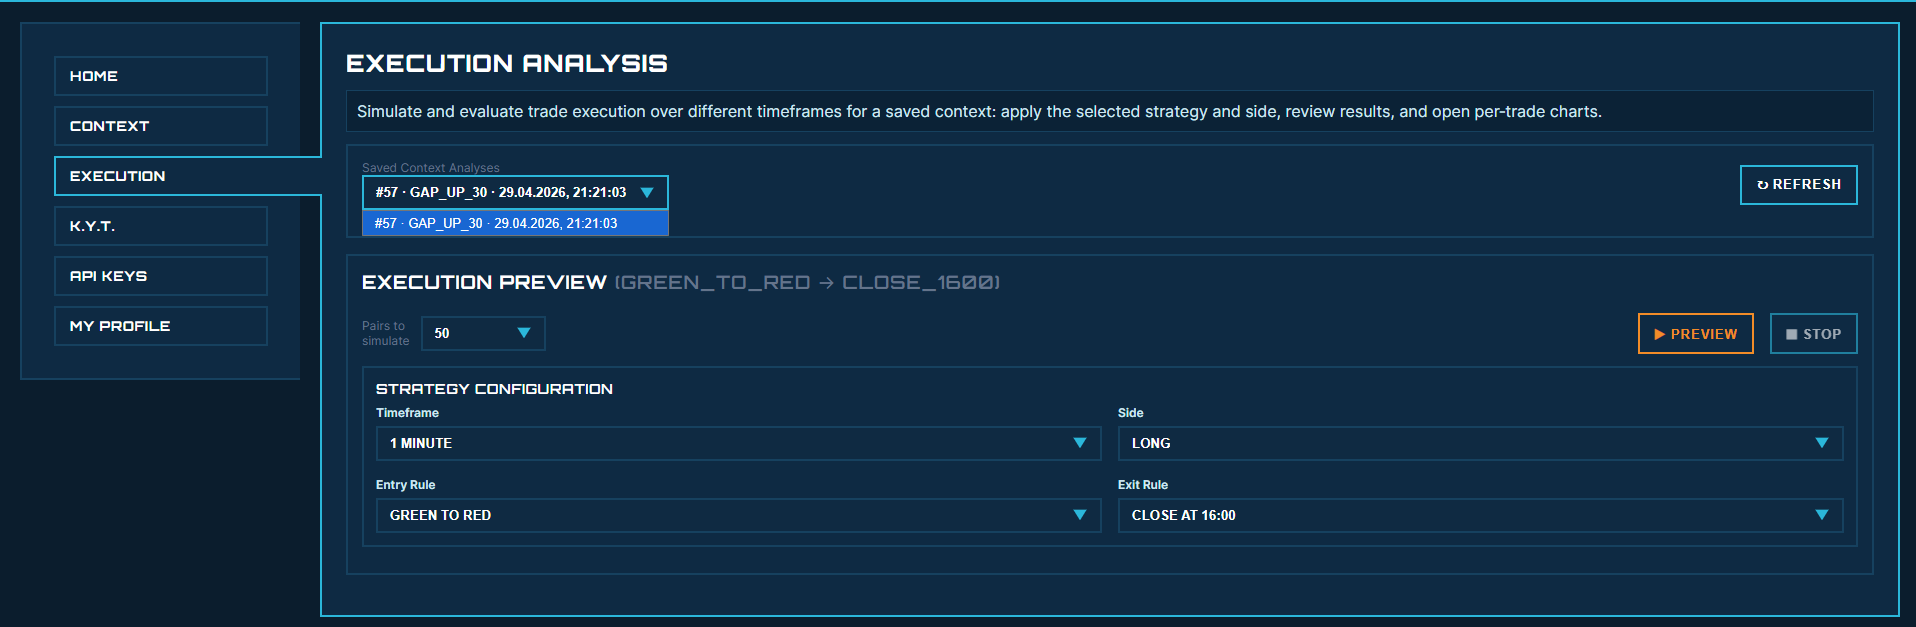
/static/images/tutorials/run-execution-analysis/01-setup.png
Configure entry and exit rules
Entry Rule decides where the simulated trade begins: Green to Red, Red to Green, Open at 09:30, or Bar Break. Exit Rule decides where it ends: Close at 16:00, Hold Minutes, or Stop Loss / Take Profit.
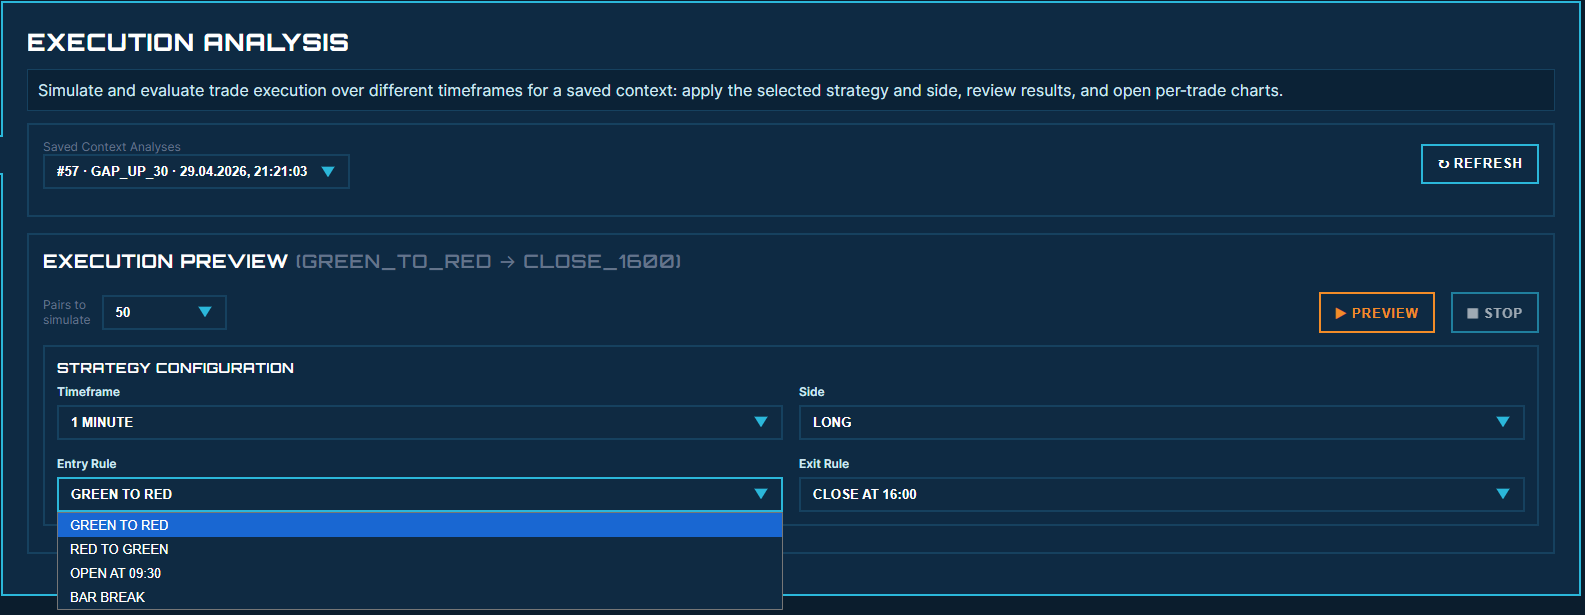
/static/images/tutorials/run-execution-analysis/02-strategy.png
Run Preview and wait for the pipeline
Preview starts a two-part pipeline. First FILTRIX prepares or reuses the required one-minute data for the selected pairs. Then it runs the execution simulation. The progress panel shows what is being downloaded, reused, inserted, or simulated.
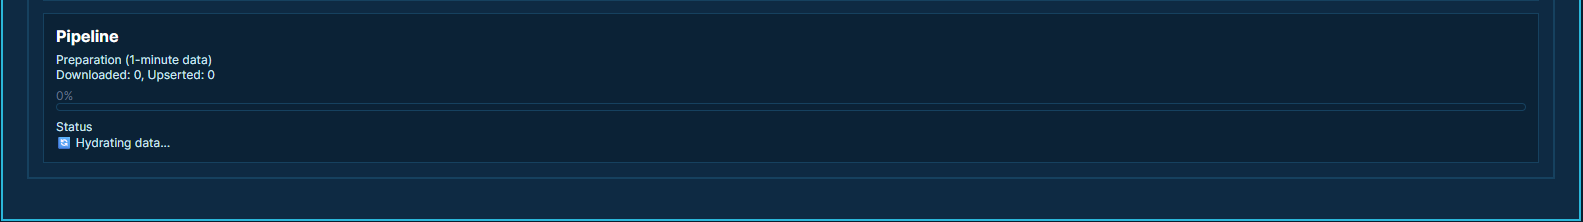
/static/images/tutorials/run-execution-analysis/03-hydration.png
Review the strategy summary and trade rows
The Strategy Summary shows Trades, Wins, Losses, Win rate, Profit Factor, Total PnL, average PnL, and holding time. The rows show each simulated trade. Click a row to open the chart and see the entry and exit in context.
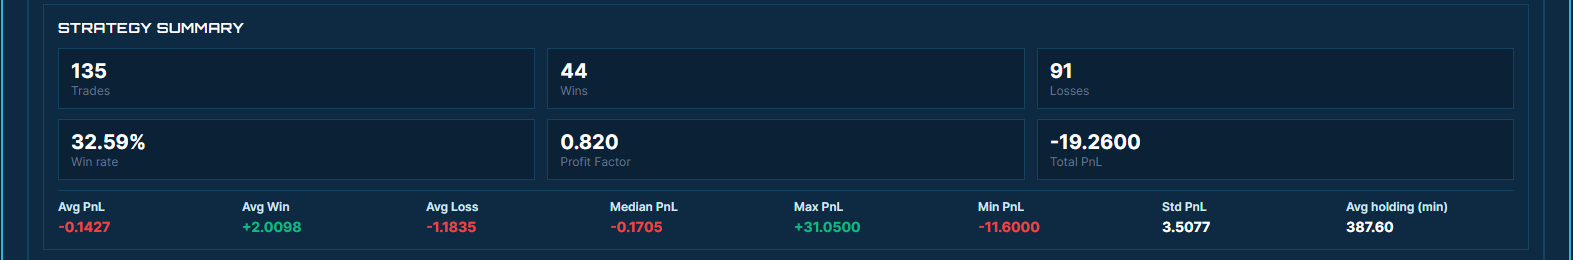
/static/images/tutorials/run-execution-analysis/04-results.png
Common Mistakes to Avoid
- Do not run ALL pairs first. Start small, inspect, then scale up.
- Do not read Win rate without Trades, Profit Factor, Total PnL, and Avg Loss.
- Do not assume a strong Context Analysis result automatically means the execution rule works.
- Do not compare strategies unless the side, timeframe, pair count, and context are the same.
Next Tutorials
How to Read Context Analysis Results
Learn how to interpret FILTRIX Context Analysis results, including total historical matches, included calculation rows, close-position bands, range buckets, preview rows, and saved contexts.
How to Validate a Trade-Ideas Alert
Turn any Trade-Ideas alert into measurable filters and check it against 400K+ historical alerts before you trade. Read the alert as data, translate it to FILTRIX filters, and decide whether the setup deserves real risk.
How to Use FILTRIX
Learn the complete FILTRIX workflow: create an account, build a trading context, run your first analysis, save it, and test execution.
Ready to test the setup?
Open FILTRIX, build the context, and let the data decide before you chase the next alert.
Run Execution Analysis